Watch time is a total: the sum of every minute anyone has spent watching your videos. Average view duration is a rate: the average length of a single view on one video. They are related but they do not move together, and a channel can have rising watch time and flat or falling average view duration at the same time.
This matters, and mistaking one for a proxy of the other leads to the wrong diagnosis — reading rising watch time as improving retention, or falling average view duration as a shrinking audience, when neither is necessarily true. One is an aggregate that rewards volume. The other is a ratio that rewards retention regardless of volume. Knowing which one you're looking at changes what you do next.
Watch time: the aggregate metric
Watch time is the total number of minutes viewers have spent watching your content, summed across every view, every video, and typically reported at the channel level over a chosen time window. YouTube Studio also shows it per video, but the channel figure is the one usually cited as "watch time" in creator conversations, and it is a total, not an average.
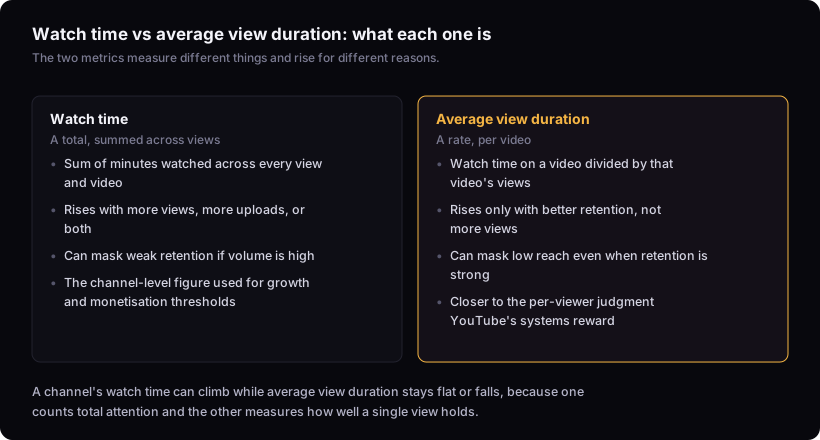
Because it's a sum, watch time rises when you publish more videos, when more people view any of them, or when either factor increases. As a worked illustration: a channel uploading 4 videos a month, each drawing 200 views and 1,000 watch-minutes, has 4,000 watch-minutes of total watch time and an average view duration of 5 minutes per video (1,000 ÷ 200). Uploading 8 videos a month at that same 200 views and 1,000 watch-minutes each gives 8,000 watch-minutes total — watch time has doubled — while average view duration is still 5 minutes, unchanged, because nothing about how any single video performs has changed. A channel that gets more views on an existing video adds watch time even if the new viewers watch a smaller share of it than earlier viewers did. Watch time answers "how much total attention did this channel capture," not "how well did any one video hold people."
Average view duration: the per-video ratio
Average view duration is calculated as total watch time on a video divided by the number of views that video received. It's a rate, not a total, which is exactly what separates it from watch time. A video's average view duration doesn't grow just because more people watched it — more views spread across the same total watch time will bring the average down unless those new viewers watch proportionally as long.
This is why average view duration can stay completely flat, or even fall, while the channel's watch time climbs. That's because average view duration is measuring something that has nothing to do with how many videos or views you're accumulating.
Where the two metrics diverge
The clearest way to see the split is to run both directions.
Direction one: watch time up, average view duration flat or down. A channel raises upload frequency or has a video get picked up by suggested and pull in a much larger audience than usual. Total minutes watched goes up substantially. But if the new viewers are less committed than the channel's regulars — clicking on curiosity rather than deep interest in the topic — the video's average view duration can sit lower than the channel's typical figure, even while that same video is the single largest contributor to watch time that month.
Direction two: average view duration high, watch time contribution tiny. Take a 10-minute video with an average view duration of 8 minutes — a strong 80% of runtime — watched by only 50 people. That's 400 watch-minutes, a rounding error next to a channel doing tens of thousands of watch-minutes a month. The retention is real; the contribution to the total isn't, simply because the audience was small. A video that few people watch cannot move the channel-level number no matter how well it retains the ones who did click.
To tell these apart in your own numbers: if channel watch time is rising, pull up YouTube Studio > Analytics > Content, and compare each recent video's average view duration against its length to get a rough percentage of runtime, then check whether that percentage has shifted over your last few uploads compared with the several before them. If it's lower or unchanged while watch time is up, the gain is coming from more uploads or more reach, not from videos holding people better — and a trajectory report built on watch time alone would show that period as uniformly healthy when only one half of it actually improved.
How this connects to audience retention graphs
Average view duration is a single summary number for a video; the retention graph shows where inside that video viewers actually left. The average tells you the video held people for roughly a certain length on average — it can't tell you whether that's because everyone dropped off steadily or because most people left at one specific point and a smaller group stayed to the end. How to read your YouTube retention graph is the tool for finding the moment, not the average.
To compare average view duration across videos of different lengths, convert it to a percentage of runtime — an 8-minute video with a 4-minute average view duration is holding people at 50%, the same as a 25-minute video averaging 12:30. That percentage is what's comparable across your library, not the raw minutes. Note it down for each upload as you go, alongside its runtime and how it was mostly discovered (search, suggested, external): a single video's number means little until you have several to set it against, and knowing the traffic source lets you separate a real retention shift from a spike or dip caused by an unusual audience. Use the retention graph to see where inside the video that percentage was earned or lost. The full breakdown of what the ratio measures and doesn't is in average view duration on YouTube: what it actually measures.
Which one YouTube's own systems actually reward
YouTube's How YouTube search works and How YouTube recommends videos documentation describe recommendations and search placement as driven by signals of viewer satisfaction and the likelihood a viewer keeps watching a given video — not by a channel's accumulated watch time. That framing describes a per-video, per-viewer judgment — closer to what average view duration approximates than to a channel-level total.
That's why average view duration is the more useful number to work from when you're trying to improve one video: it's the metric that reflects a single viewer's experience, which is what YouTube's own guidance says its systems weigh, rather than a total that changes just because you published more. Watch time still matters as the headline figure for reporting channel growth, and it's also the total YouTube uses for its own Partner Program eligibility requirement — see YouTube's Partner Program requirements, which state the current watch-hours threshold — but it isn't the number that describes how one video is performing against expectation.
What to check depending on your goal
If you're diagnosing why a specific video underperformed, convert its average view duration to a percentage of its runtime, then compare that percentage against the same figure for your last several uploads of comparable length. A lower percentage than that recent set points to a retention problem: open the retention graph and look for where the drop-off is concentrated, then reconsider the pacing or structure around that point in future edits. A similar percentage alongside a view count well below your usual for videos of that length and topic points to a discovery problem instead: check impressions and click-through rate on the video to see whether the thumbnail or title is the bottleneck rather than the content itself. If you're assessing the channel's overall direction — whether the account as a whole is gaining traction — watch time is the more honest total, but check it alongside average view duration on your recent uploads so a run of extra publishing doesn't get mistaken for improving retention.
Neither metric tells you about discovery. A video can have excellent average view duration and still be found by almost nobody, which is a click-through and impressions problem, not a retention problem — covered in YouTube impressions vs views: what the pair actually tells you and what is a good click-through rate on YouTube?. Related decisions worth checking alongside this one: how long should a YouTube video be? and how often should you upload to YouTube? a diagnostic, since both directly move watch time without necessarily moving average view duration at all. The full set of terms is in the metric glossary.
What this doesn't cover
This doesn't give you a benchmark for either number — there isn't a general figure that applies across channels, only your own history to compare against. It can't tell you what your own watch time or average view duration should be. And it doesn't cover Shorts, where playback metrics behave differently from long-form video and this comparison doesn't apply directly.