Most metrics in YouTube Analytics describe what happened. A few tell you what to fix. The skill in reading the dashboard isn't knowing what every tab means — it's knowing which numbers are diagnostic and which are just scenery, and reading the diagnostic ones in the right order.
This article won't tell you whether your specific numbers are good. Nobody can do that without your channel's history, and YouTube itself doesn't publish fixed benchmarks for the metrics creators worry about most. What follows is the order to check things in, and which pairs of numbers only mean something read together.
Descriptive vs diagnostic: not every metric tells you what to do
A descriptive metric tells you an outcome. A diagnostic metric points at a fixable cause. Total views, watch time and subscriber count are almost entirely descriptive — they tell you a video did well or badly, but not why. Impressions click-through rate, average view duration and retention at specific timestamps are diagnostic, because each one isolates a stage of the viewer's decision: did they see it, did they click it, did they stay.
The reason creators stare at a dashboard without acting is usually that they're reading the descriptive numbers as if they were diagnostic. A views count going down tells you something is wrong. It doesn't tell you whether the problem is the thumbnail, the topic, or the algorithm showing it to fewer people in the first place. For that you need to go one level down.
Impressions and CTR: what the number is, and what it can't tell you
An impression is counted when a thumbnail is shown to a viewer on YouTube for long enough and prominently enough for that viewer to plausibly have seen it — it is a visibility measure, not a promise of attention, and a thumbnail flashed at the edge of a screen for a fraction of a second doesn't reliably count the same way a thumbnail sitting in the middle of someone's home feed does. Impressions click-through rate is the share of those impressions that turned into a click.
YouTube gives no benchmark for what counts as a good CTR. There's no published figure, and any number you find quoted online is someone's guess dressed up as a standard — a channel in one niche can run a CTR that would be alarming in another and be completely normal for its audience and thumbnail style. The only comparison that means anything is a video against that same channel's own recent pattern. A full breakdown of what counts as an impression and why the threshold matters for interpretation is in youtube impressions vs views: what the pair actually tells you, and the case against chasing a universal CTR number is laid out in what is a good click-through rate on youtube?.
Average view duration and retention: reading them next to CTR, not instead of it
CTR answers a packaging question — did the thumbnail and title get someone to click. Average view duration and the retention graph answer a content question — did the video hold that person once they arrived. Reading either number alone tells you half a story, and the wrong half if you draw a conclusion from it.
A video with strong CTR and weak retention has a packaging that oversells the content: people click, then leave, because the video didn't deliver what the thumbnail promised. A video with weak CTR and strong retention among the few who do click has the opposite problem: the content works, but the packaging isn't getting anyone through the door. These look identical in a total-views number and completely different once you cross-read the two metrics. What average view duration measures and where it stops being useful is covered in average view duration on youtube: what it actually measures, and the retention graph itself — including how to spot a drop that's a real problem versus normal — is in how to read your youtube retention graph.
Search vs suggested vs browse: why one metric set doesn't fit all traffic
YouTube ranks search results largely on how closely a title and description match a query, combined with engagement signals on the video. Suggested and browse placements — the home feed, the "up next" panel — work on a different basis: what a viewer is likely to watch next given their history, which is closer to personalisation than to keyword matching. These are documented as distinct systems in YouTube's own creator-facing material, not two names for the same mechanism.
This matters because a single metric set doesn't diagnose both. A video getting most of its traffic from suggested feeds is being judged on watch patterns and session behaviour, and its CTR reflects competition against other suggested thumbnails in a feed, not against search results. A video getting traffic from search is competing on title and description match first. Before blaming CTR or retention for anything, check the traffic-source breakdown in Analytics to see which system is actually delivering the views — otherwise you may be fixing a problem for the wrong kind of traffic.
Where tags fit, and where they don't
Tags play a minimal role in discovery according to YouTube's own creator documentation, mattering mainly for catching common misspellings of a title or topic — not as a general ranking lever. Creators routinely overweight tags relative to title, thumbnail and description, which is where YouTube's stated guidance actually points attention. The full case, including what tags do instead of what people assume they do, is in do youtube tags still matter? what they actually do now.
If you're spending time tuning a tag list before you've tightened a title or tested a thumbnail at actual size, the order of operations is backwards. Title and thumbnail carry the click decision. Tags carry almost nothing by comparison.
A practical order for reading the dashboard when a video under- or overperforms
Check the numbers in this order, because each one narrows down what the previous one could mean:
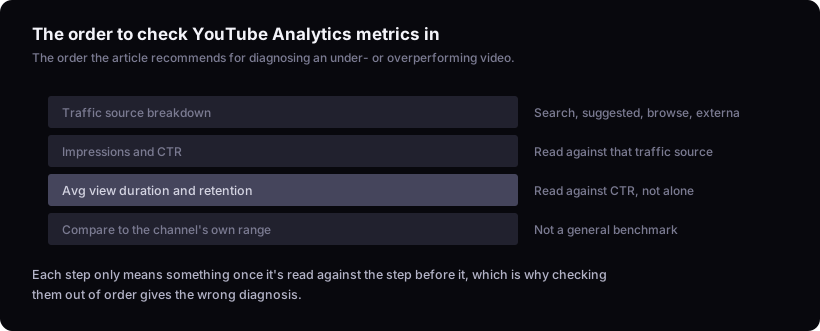
- Traffic source breakdown. Is this video getting views from search, suggested, browse, or external? This decides which ranking system and which metrics are even relevant.
- Impressions and CTR, read against that traffic source. A CTR that looks low in isolation may be normal for suggested placement and low for search, or the reverse.
- Average view duration and the retention graph, read against CTR. Together these separate a packaging problem from a content problem.
- Compare all of the above against the channel's own recent range, not a general benchmark, since none exists for CTR or similar figures.
This is also the point where a video's overall view count against a channel's own baseline becomes worth a second look — what's actually unusual for that channel, rather than what looks big in absolute terms, is covered in what is an outlier video on youtube?. For the exact definitions of each term used above, the metric glossary has the arithmetic behind each one.
The limit here
This article explains how to interpret the numbers YouTube shows, not what any specific channel's numbers currently say. It has no access to a live dashboard, and it can't tell you whether your CTR, retention or impressions are good — YouTube publishes no fixed benchmark for these, and the only meaningful comparison is your own channel's history over time. How that comparison gets built from your own data is described in how our data works.
Open your own Analytics tab next to this order and work through it once on a video you already have questions about. That's a better use of the next ten minutes than reading a sixth definition of average view duration.