Average view duration is the total watch time a video earns divided by the total number of views it gets. YouTube Studio reports it as a single number, usually in minutes and seconds, but that number is a mean — and a mean pulled from a mix of ten-second bounces and full rewatches tells you almost nothing about what a typical viewer did.
What average view duration actually measures
The calculation is arithmetic, not judgement: sum every second of watch time across every view, divide by the count of views. That is it. There is no adjustment for outliers, no weighting by viewer intent, and no distinction between someone who watched attentively and someone who left the tab open in another window.
This is worth stating plainly because most explanations stop at the definition and let the reader assume the number scores viewer satisfaction. It doesn't. It's a division, and divisions are only as informative as their inputs. A small number of very long or very short views can move the average without a single "typical" viewer changing behaviour at all.
Why the average hides more than it shows
A mean collapses a distribution into one point, and distributions in view data are rarely tidy. Ten viewers watching three minutes each and one viewer watching thirty minutes will produce a very different average than eleven viewers all watching roughly the same amount — even though the second scenario is the one most creators picture when they see the number.
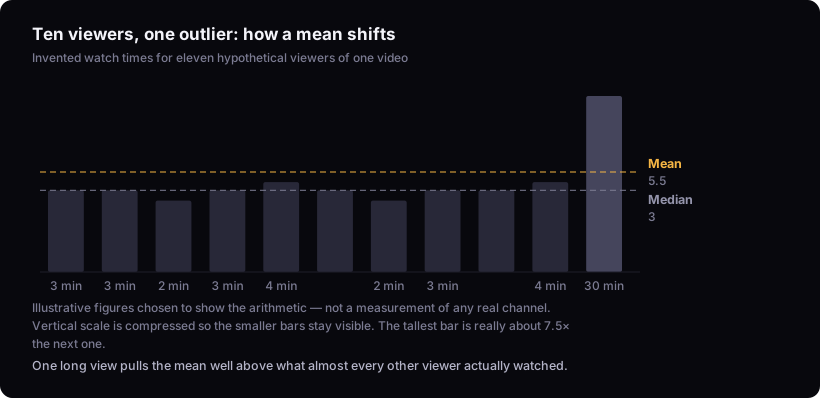
This matters because two videos can post an identical average view duration while having completely different audiences. One might have a tight cluster of viewers all watching about the same portion. The other might have a long tail of skimmers offset by a handful of loyal rewatchers. The number can't tell these apart. Only the retention curve underneath it can, which is why the average is a starting point, not a verdict.
Average view duration vs average percentage viewed
Average view duration is a raw time figure — minutes and seconds of watch time per view. Average percentage viewed is the same idea expressed as a proportion of the video's total length, so it already accounts for how long the video is.
The two answer different questions. If you want to know how much absolute time your content is holding people for, use average view duration. If you want to know how much of the video itself people got through, use average percentage viewed. A short video can have a low average view duration in seconds but a high percentage viewed, and a long video can show the opposite. Reading one without the other is where most of the confusion about "good" numbers comes from. the metric glossary breaks down how this sits alongside related retention terms if the distinction still feels slippery in practice.
Why length and format change what counts as normal
Comparing average view duration across videos of different lengths is a category error, because the metric isn't normalised for length. A three-minute video that holds people for two minutes has a very different story than a twenty-minute video that holds people for two minutes, even though the raw figure is identical.
The only comparisons that mean anything are a video against its own length, or a video against other videos of similar length and format on the same channel. Cross-video or cross-channel comparisons of the raw number, without controlling for length, tell you nothing you can act on. This is also why generic "good AVD" targets circulating online are close to meaningless — they rarely specify the video length they were calculated against.
What can quietly move the number
A drop in average view duration doesn't always mean people are watching less attentively. Because the metric is total watch time divided by total views, anything that changes the denominator without changing viewer behaviour will move the result.
The clearest example is packaging that pulls in low-intent clicks. A misleading title or thumbnail can spike views from people who click, realise within seconds it isn't what they expected, and leave — dragging the average down even though everyone who was already going to watch the video watched exactly as much as before. A shift in traffic source mix works the same way: a video that suddenly gets pushed to a colder audience will often show a lower average, not because retention got worse, but because the mix of who's watching changed. Before reading a drop as a content problem, it's worth checking whether it's a packaging or traffic problem instead — why your youtube videos aren't getting views walks through how packaging and traffic interact with the numbers Studio reports.
What counts as a 'good' average view duration
There isn't one, and any figure offered without your video's length and format attached should be treated as decoration rather than a target. A "good" average view duration for a four-minute video and a "good" one for a forty-minute video are different quantities entirely, and even within one length bracket, format (tutorial, vlog, commentary) changes what's typical enough that a single cross-niche number can't hold.
The only benchmark that means anything is the video against itself over time, or against a close set of similar videos on the same channel. That comparison is available to you in your own analytics. A number pulled from a blog post is not.
Where average view duration fits in a wider retention check
Average view duration is one input, not the whole diagnosis. It's a useful early signal — a fast way to notice that something changed — but it doesn't say why, and it can't distinguish a packaging problem from a pacing problem from a genuine content issue on its own.
The retention curve itself, the traffic source breakdown, and the video's own history are what turn "the average moved" into an actual explanation. If you're trying to work out whether a shift in this number reflects something about the video or something about who's clicking on it, the video teardown walks the retention curve and traffic mix together rather than in isolation. And if the comparison you actually want is against another channel rather than your own history, how to analyse a competitor's youtube channel covers what's actually comparable across channels and what isn't.
The limit here
This article explains the published definition and mechanics of average view duration. It draws on no first-hand testing, no account data, and no observed creator behaviour. It cannot tell you what your own number should be, because that depends on your video's length, format, and audience — context this piece has no access to. For how any tool built on top of this metric handles that context, how our data works documents the method directly.
The next step isn't finding a target number. It's pulling up your own retention curve for the video in question and checking whether the drop-off is early, late, or evenly spread — that shape tells you more than the average ever will.