To find outlier videos, you compare each video against the median of its own channel rather than against the rest of YouTube. You can do this by hand for one channel in about ten minutes, and the arithmetic is simple enough that it is worth doing once even if you later automate it — because doing it once teaches you which numbers to distrust.
This assumes you know what an outlier factor is. If not, start there; the rest of this will be more useful afterwards.
Finding outlier videos by hand, one channel at a time
1. Pick channels roughly your size, not the biggest in the niche. A channel with 30 times your subscriber count is solving a different problem. Their outliers are driven by an existing audience you do not have. Somewhere between half and three times your size is where the findings transfer.
2. Open their uploads, sorted by newest. Not by popular. Sorting by popular shows you their all-time hits, which is a survivorship view — you will see what worked years ago and nothing about what is working now.
3. Take the last 30 to 50 uploads and write down the view counts. Skip anything published in the last two weeks. It has not finished accumulating views, and including it will drag your baseline down and make everything else look like an outlier.
4. Split Shorts from long-form before you do anything else. Do not skip this. The two are surfaced differently and pull from different pools, so on most channels their view counts sit in visibly different ranges — mixing them produces a median that describes neither. You will see this immediately in the numbers you just wrote down. Anything about three minutes or under is a Short.
5. Take the median of each group, not the average. This is the step that matters most, and it is the one most people get wrong. One runaway video pulls a mean upward enough to hide every other outlier in the set. The median is the middle value when you sort them — it ignores the extremes, which is exactly what you want when the extremes are what you are hunting for.
Here is the difference on a made-up set of nine uploads. These numbers are an arithmetic demonstration, not a measurement of any real channel:
| Views | |
|---|---|
| Uploads, sorted | 8,100 · 9,400 · 11,200 · 12,000 · 12,600 · 13,900 · 15,000 · 18,700 · 940,000 |
| Mean | 115,656 |
| Median | 12,600 |
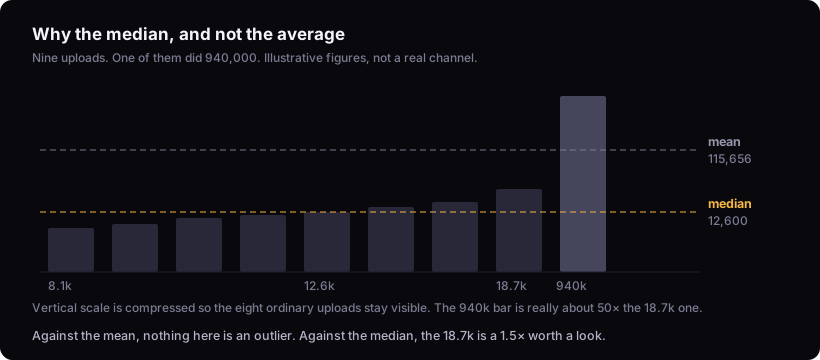
One video did 940,000. Against the mean, nothing on that channel is an outlier — not even the 940,000, which comes out at 8.1×, while the 18,700 scores 0.16× and looks like a failure. Against the median, the 18,700 is a 1.5× worth a look and the runaway is a 74.6× you should ignore as a broken denominator.
Same nine videos. Completely different reading. That is the whole reason for the median.
6. Divide each video by its group's median. Anything at 2× or more is worth a look. Anything at 3× or more on a topic-matched sample is a strong signal.
7. Ignore the extremes. Past roughly 15×, you have usually found a channel with a low median rather than a video with a high ceiling — a dormant period, a format change, a run of test uploads. The 2× to 8× range is where something repeatable probably happened.
Reading what you found
A list of outliers is not an answer. It is a list of questions, and the useful work starts here.
For each one, look at what is actually different from the videos around it. The four things worth checking, in order:
- Topic. Is this subject different from the channel's usual? Most outliers are topic outliers, and topic is the most transferable finding.
- Packaging. Does the title promise something more specific than its neighbours? Is the thumbnail structurally different — a face where there usually is none, text where there usually is none?
- Format. Longer, shorter, a list where they usually do essays, a collaboration.
- Timing. Did it land next to something happening in the world?
The honest answer is often "I cannot tell from outside," and that is a legitimate result. Write it down and move on rather than inventing a cause — a made-up explanation you then act on is worse than no explanation.
Three mistakes that make the number lie
Using the average instead of the median. Already covered, and still the most common. If a channel has one 2-million-view video and forty 20,000-view videos, the mean is around 70,000 and nothing else will ever look like an outlier. The median is 20,000, and the picture is completely different.
Comparing against the niche instead of the channel. "This video got more views than most videos about espresso machines" tells you the channel is big. It is a subscriber-count measurement wearing a performance costume. The channel's own median is the only baseline that isolates the video.
Treating a thin baseline as a real one. Five uploads is the practical minimum, and five is not many. A factor computed from three videos is arithmetic, not evidence. When there is not enough history, the correct output is "I do not know," and that is why PublishBench refuses to print a factor below its minimum rather than showing a confident-looking ratio.
Doing it continuously instead of once
The manual method finds what already happened. The more useful version is a standing list, because an outlier is most actionable in the days after it lands, while the topic is still open.
That means picking 10 to 20 channels in your niche and re-checking them on a cadence. By hand this is genuinely tedious — recomputing a median across 50 uploads for 20 channels every week is an hour you will stop spending after the second week.
Two PublishBench tools do this, and both cost no credits:
- The channel watchlist tracks channels you choose and re-checks them daily for uploads that beat that channel's own median, with Shorts and long-form kept on separate baselines. Every row states which baseline produced its number, and a channel without enough settled uploads says "no baseline yet" rather than inventing one.
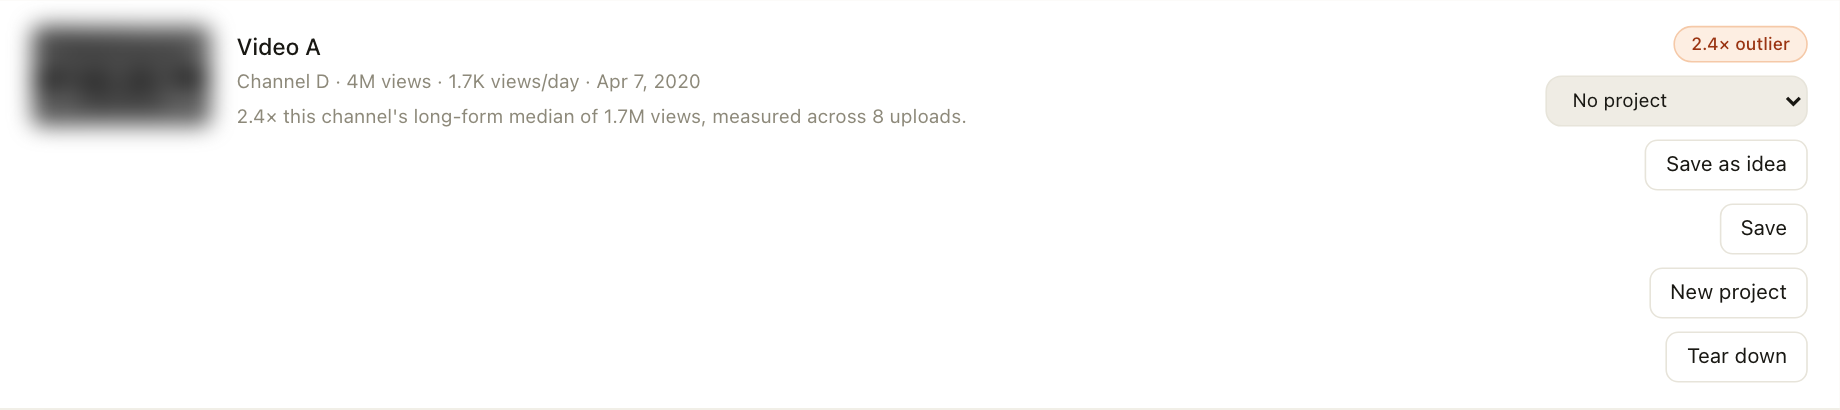
- The outlier explorer searches across everything the platform has already researched, so you can find outliers by topic rather than by channel.
The explorer's limit is stated on the page: it covers a rolling 30-day window of what has already been fetched, not a crawl of all of YouTube, and it prints the video and channel counts above the results so you can see the size of the pool you are searching. Both use the same arithmetic described above, and both are on the free plan.
The exact formulas, thresholds and sample sizes behind them are published at how our data works — worth reading before you take any tool's outlier number at face value, ours included.
Where this method stops working
It cannot tell you why any of it happened. The factor is division over public view counts. Why a video overperformed is not in that data, and no amount of arithmetic will put it there.
It is weakest exactly where you most want it. A channel that posts irregularly, changed format recently, or has fewer than a handful of settled uploads will not produce a trustworthy median — and those are often the interesting channels.
An outlier in someone else's niche is not a video idea for you. It is evidence that a topic had demand on a channel with a particular audience. Whether that transfers depends on overlap you have to judge yourself.
Finding them is the easy half. The transferable thing is almost never the topic verbatim — it is the angle, the specificity of the promise, or the format decision underneath it. That reading is a judgement, and no tool makes it for you.